pV Diagram
What is all this?
Ees [mmHg/mL/m2] - End systolic elastance
mmHg/mL/m2
R [mmHg x s/mL] - Total resistance
[mmHg x s/mL]
HR [BPM] - Heart rate
BPM
Ved [mL] - End diastolic volume
mL
Clinical examples:
Show more
Show more
Show more
End systolic elastance (Ees)
End-systolic elastance shows the slope angle of the end-systolic pressure volume relationship (ESPVR). It is a measure of the heart contractility, resulting in a steeper slope when contractility is enhanced and vice versa.
Total peripheral resistance (TPR)
Total peripheral resistance is the resistance of the entire systemic vasculature that resists the flow of blood and generates pressure. Increasing the resistance increases the slope of the Ea line and vice versa. I want to know more
Heart rate (HR)
The heart rate is an intrinsic quality of the heart. It directly shows how many electric signals the heart's internal pacemaker produces, which results in a number of contractions per minute (BPM). It is strongly affected by autonomic nervous system, with sympathetic stimulation increasing and parasympathetic stimulation decreasing the heart rate. Increased heart rate causes Ea line to be steeper and vice versa. I want to know more
End-diastolic volume (EDV)
End-diastolic volume is a variable that represents the hearts ability to expand and fill with blood. It represents the maximal ventricular volume prior to contraction. It is a direct result of the interplay between end-diastolic elastance, end-diastolic (filling) pressure, and the duration of the filling phase.
Theory
Wiggers diagram and pressure-volume loop
To fully understand the pressure-volume loop, we will first take a look at the so-called Wiggers diagram, which is a very useful tool in cardiac physiology for presenting the cardiac cycle. It usually integrates changes in pressures of the left ventricle, left atrium and the aorta, ventricular volume, and electrocardiogram. It also often contains depictions of sound phenomena. In this chapter, however, we will only focus on the pressure and the volume of the left ventricle and from that derive the pressure-volume loop.
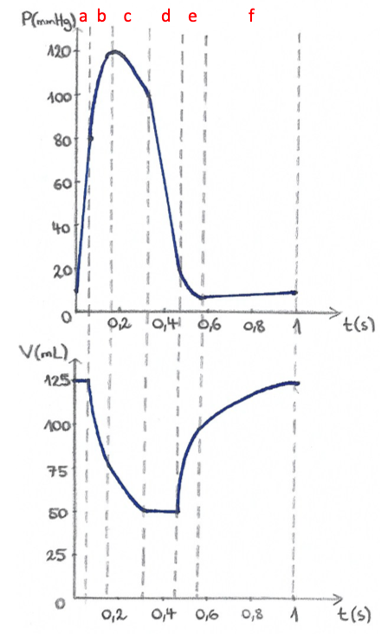
To generate the pressure-volume loop for the left ventricle, we plot left ventricular pressure against left ventricular volume at multiple time points during the same cardiac cycle. Thus, points A, B, C, D, and F on the P-V loop corelate with the dotted lines in the Wiggers diagram.
Cardiac cycle and the P-V loop:
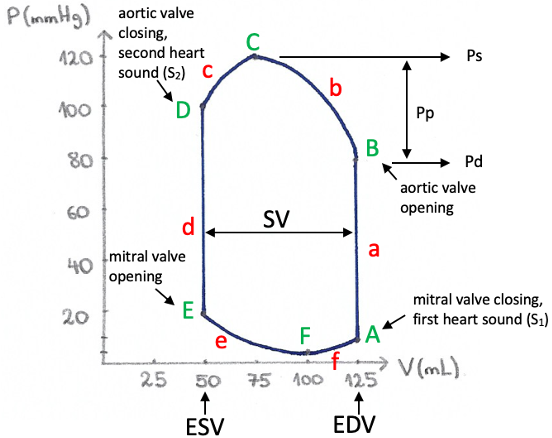
Cardiac cycle is divided into two phases: the systole and the diastole. The systole comprises of isovolumetric
ventricular contraction (a), rapid ventricular ejection (b) and reduced ventricular ejection (c), i.e., the
interval A→D. The diastole includes isovolumetric ventricular relaxation (d), rapid ventricular filling (e) and
reduced ventricular filling (f), i.e., the interval D→A.
Point A on the P-V loop represents the state of left ventricle at the end of the diastole. Volume and pressure
in point A are therefore called the end-diastolic volume (EDV; 125 mL) and the end-diastolic pressure (10 mmHg).
As the cardiac cycle begins and the ventricle starts to contract, the pressure rises rapidly. Because all heart
valves are closed at that time, no blood can leave the ventricle, therefore the volume remains constant, thus
the name
“isovolumetric”
contraction (a).
When the rising pressure in the left ventricle rises above the pressure in the aorta (80 mmHg), the aortic valve opens (B). What follows is the rapid ventricular ejection (b), during which most of the stroke volume is ejected into the aorta. Ventricular pressure reaches its maximum at point C (systolic pressure; 120 mmHg). Myocardial excitation subsequently decreases and the ventricle no longer contracts, causing the ventricular pressure to fall. Blood is still being ejected into the aorta but at a reduced rate - reduced ventricular ejection (c). As ventricular pressure falls below that in the aorta (D), the aortic valve closes, producing the second heart sound (S2). This also marks the end of the systole (A→D). Volume contained in the ventricle at this point of the cardiac cycle is called the end-systolic volume – ESV (50 mL) and the pressure is end-systolic pressure (100 mmHg). Due to muscle relaxation, left ventricular pressure continues to fall, but because all the valves are closed, the volume remains the same - isovolumetric relaxation (d).
When left ventricular pressure falls below the one in the left atrium, the mitral valve opens (E). This results in rapid ventricular filling (e), during which left ventricular volume increases rapidly, pressure however remains low, because the ventricle is relaxing further and thus highly compliant. Reduced ventricular filling (f) is the longest phase of the cardiac cycle and is mostly affected when heart rate increases. Atrial systole marks the end of the diastole (D→A), at which point ventricular volume is equal to EDV (A). At point A, when left ventricular pressure rises above the one in the left atrium, the mitral valve closes, producing the first heart sound (S1).What information can we gain from the pressure-volume loop?
The width of this pressure-volume loop represents the difference between maximum (EDV) and minimum volume (ESV)
in the cardiac cycle. This difference between EDV and ESV represents the amount of blood ejected during a single
cardiac cycle and is called the stroke volume (SV). In our case, this equals 125 mL - 50 mL = 75 mL.
Another
value which we cannot directly see in the P-V loop, but can calculate it and with some experience also see in
the graph, is the ejection fraction (EF), which is the fraction of the end-diastolic volume that is
ejected by
the ventricle in one stroke volume. Thus EF = SV/EDV, which in our case equals to 75 mL/125 mL = 0.6 or 60 %.
Visually, this corresponds to the ratio between two lengths: the width of the SV divided by the distance between
the origin of the coordinate system and EDV.
At point B of the P-V loop, the ventricular pressure just exceeds the aortic pressure; this pressure therefore
reflects the pressure existing in the aorta at the onset of ejection and is called diastolic pressure
(Pd).
During the ejection phase, aortic and ventricular pressure are essentially equal; therefore the point of
greatest pressure on the loop also represents the greatest pressure in the aorta and is called systolic
pressure
(Ps). The pulse pressure (Pp), which is the difference between systolic pressure (Ps) at point C
and
diastolic
pressure (Pd) at point B, can therefore also be determined. In our case, it would be 40 mmHg (120 – 80 mmHg).
With the help of a pressure-volume loop we can also visualise time points when certain valve pathologies can be
heard during heart auscultation. I want to know
more
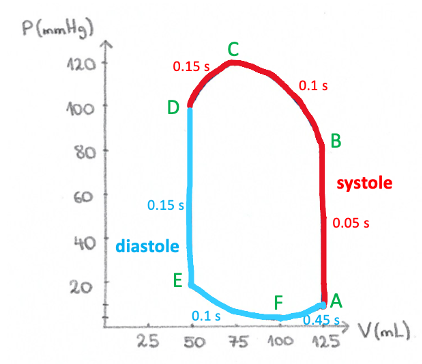
Duration of cardiac cycle phases
Although pressure-volume loop provides a useful visualization of the changing pressures and volumes during a cardiac cycle, these representations of the cardiac function do not depict rates because the time scale is eliminated in their construction. Therefore, a longer line in the P-V diagram does not mean that the particular phase of the cardiac cycle lasts longer, which is shown in the picture below. The whole systole lasts approximately 0.3 seconds and the total duration of the diastole is around 0.7 seconds, yet they appear almost equally “long” on the P-V diagram.
IMPORTANT PHYSIOLOGICAL ENTITIES
Preload
Preload can be defined as the stretching of cardiac muscle prior to the systole imposed on the heart by initial sarcomere length and end-diastolic volume. The Frank-Starling’s law of the heart
states that a greater fiber length causes the heart to deliver more mechanical energy, i.e., to contract more, and it therefore focuses on preload. The direct effect of preload on the heart can be seen by regulating the end-diastolic volume in our graph, where a higher end-diastolic volume, i.e., more blood in the ventricle at the end of diastole, results in a higher stroke volume and higher generated pressure. Importantly, one cannot simply raise the end-diastolic volume endlessly. One has to take into account the end-diastolic pressure volume relationship (see below), which limits ventricular distention.Afterload
Afterload portrays forces that the contracting myocytes must overcome. It may be defined as the tension or stress developed in the ventricle wall during ejection. A convenient index of the opposing forces is arterial pressure that opposes blood flow from the ventricles. However, under pathologic conditions when either the mitral valve is incompetent (i.e., leaky) or the aortic valve is stenotic (i.e., constricted) afterload is also determined by factors other than the properties of the arterial system. Myocytes that try to overcome a greater afterload do so with a higher tension and contract more slowly than myocytes overcoming a lower afterload.
End-systolic pressure-volume relationship (ESPVR)
If one measured the pressure in the ventricle after systole (end-systolic pressure) for multiple cardiac cycles
with different end-diastolic volumes, provided other physiological parameters - such as contractility - would
not change, the end-systolic pressure values would fall along a line when plotted in a graph. This line is also
termed the end-systolic pressure-volume relationship (ESPVR), because it represents the relationship between
pressure and volume at an instant of maximal activation – end-systole. The steepness of the slope represents
cardiac contractility, where a steeper slope shows higher contractility, stroke volume and blood pressure
generated.
Here, we must point out that the ESPVR line is not actually completely linear, but is in fact curvilinear.
Although in situ end-systolic pressure-volume relations are approximately linear throughout a limited load
range, they often yield seemingly negative volume-axis intercepts (V0), and even V0 shifts with inotropic
interventions. As Kass et al. (1989) described in their study, curvilinearity can explain this frequent
observation of apparently negative V0 and large shifts in V0 with alterations in contractile state. In our graph
however, we have used the linear ESPVR model and a fixed volume-axis intercept (V0) for the sake of
simplification of this complex concept.
End-diastolic pressure-volume relationship (EDPVR)
End-diastolic pressure-volume relationship is the relationship between pressure and volume in the ventricle at the instant of complete relaxation (end-diastole). One could imagine the heart as an empty balloon, even when there is no pressure on the wall, there is still some volume left in the opening. The volume at pressure 0 is often referred to as V0 or unstressed volume (not the same as the V0 in ESPVR).
When the heart slowly begins to fill with blood, the pressure remains constantly low, until at some point it begins to rise rapidly. This point is dependent on the heart’s intrinsic properties, such as compliance. The EDPVR limits the distention of the heart’s ventricles during the diastole.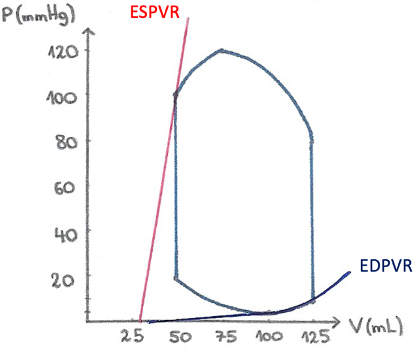
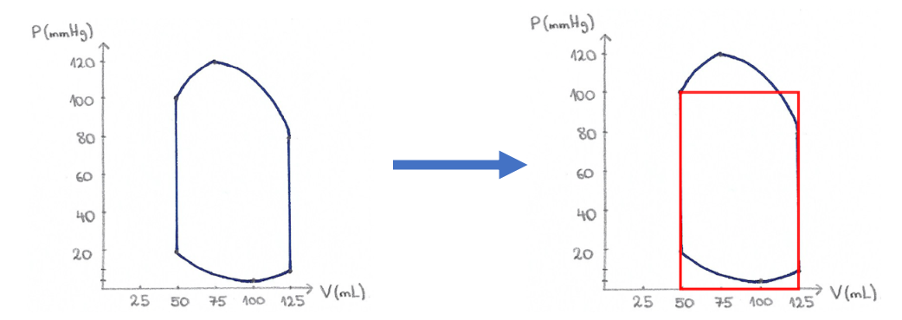
P-V loop → P-V box
Up to now, we have drawn and explained what the actual pressure-volume loop looks like. However, as in our interactive model, you will often see a pressure-volume box being used instead to describe how changes in different parameters affect the pressure and volume of the left ventricle. By converting to the simplified P-V box (shown in the picture below), we lose some information from the P-V loop, such as systolic and diastolic pressure or end-diastolic pressure, but make it easier to represent changes in certain parameters. There are three parameters, which we can then tweak in order to change the shape of this P-V box. These are:
- contractility of the heart, which changes the slope of the ESPVR line (Ees),
- arterial elastance (Ea), whose slope can be changed by changing resistance (afterload) or the heart rate,
- preload (EDV), which moves the Ea line to the left or right but does not change its slope, only its intercept with the x-axis, i.e., preload.
Noteworthy, the part of the surface that is lost on top is roughly compensated for by the surface gained in the bottom. Therefore, the surface area, which depicts the work of a cycle, does not change considerably.
References
- Fukuta H, Little CW. The Cardiac Cycle and the Physiological Basis of Left Ventricular Contraction, Ejection, Relaxation and Filling. Heart Fail Clin. 2008; 4(1):1-11.
- Boulpaep EL. The Heart as a Pump. In: Boron WF, Boulpaep EL. Medical physiology. 2nd ed. Philadelphia: Saunders/Elsevier; 2012. p. 529-53.
- Hall JE. Cardiac Muscle; The Heart as a Pump and Function of the Heart Valves. In: Hall JE. Guyton and Hall textbook of medical physiology. 13th ed. Philadelphia: Elsevier; 2016. p.115-22.
- Burkhoff D. Mechanical properties of the heart and its interaction with the vascular system. [Internet] Available at: http://www.columbia.edu/itc/gsas/g6001/BasicLVMechanics.pdf [Accessed on 3. 5. 2017]
- Sagawa K. The end-systolic pressure-volume relation of the ventricle: definition, modifications and clinical use. Circ Res. 1981;63(6):1223-7.
- Sunagawa K, Maughan WL, Friesinger GC, Chang M, Sagawa K: Coronary perfusion pressure and left ventricular end systolic pressure-volume relation. Circ. 1980; 62(suppl III):111-203
- Sunagawa K, Sagawa K, Maughan WL. Ventricular interaction with the loading system. Ann Biomed Eng. 1984;12(2):163-89
- Asanoi H, Sasayama S, Kameyama T. Ventriculoarterial coupling in normal and failing heart in humans. Circ Res. 1989;65(2):483-93.